Lorem ipsum dolor sit amet, consectetur adipiscing elit, sed do eiusmod tempor incididunt ut labore et dolore magna aliqua. Ut enim ad minim veniam, quis nostrud exercitation ullamco laboris nisi ut aliquip ex ea commodo consequat. Duis aute irure dolor in reprehenderit in voluptate velit esse cillum dolore eu fugiat nulla pariatur.
Getting actionable insights from user data is now table stakes for all Software applications, and has long been a complex, time-consuming process. Competing product analytics tools often require months of setup and extensive developer involvement—delaying results and dampening momentum.
What’s New
ThriveStack's new Product Engagement Report takes <10 mins to setup, delivers instant insights with zero hassle. It auto-analyzes your event data to reveal:
Feature Adoption rates, usage frequency, Time to adoption
Account and User-level behavior patterns
Viral growth features
Why It Matters
While our competition takes 3–6 months to show results, ThriveStack's guided setup, real-time validation, and instant reporting make data accessible from Day 1.
Hear it directly from our customers
"It took over 4 months to get Amplitude running. With ThriveStack, we were up and running in no time—and now, our product and engineering team uses it to understand what features to instrument and the real time analytics reports are an incredible value" - Devon Jones, VP of Product Management.
Now, Turn onboarding into your product’s growth engine.
Background
Onboarding event tracking has often been a bottleneck—developer-dependent and misaligned with product goals. This led to delays in understanding activation metrics and acting on customer friction points.
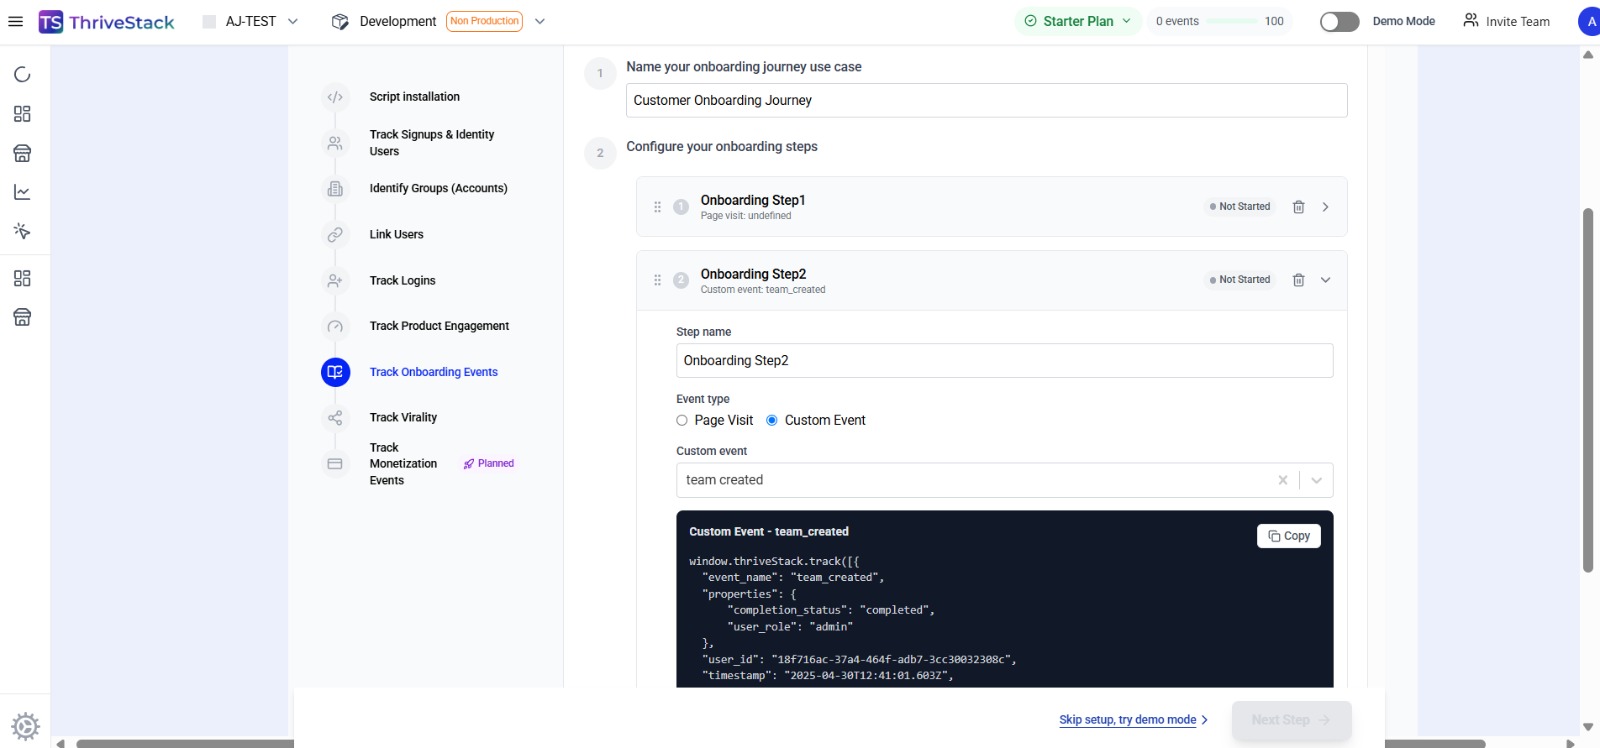
What’s New
ThriveStack’s PM-first collaboration model redefines how teams track onboarding:
PMs define key milestones
Developers receive auto-generated code snippets for seamless implementation
Teams gain visibility into drop-offs, time-to-value, and get alerts on activation struggles
Why It Matters
This intuitive interface aligns product vision with technical execution, enabling faster setup, deeper insights, and proactive engagement—all without the usual friction.
Auto-Correlation from Visitor to Signed-Up Users
Connect the dots from first visit to product activation—automatically.
Background
Traditionally, teams needed external tools and deep technical know-how to correlate web visitors with signed-up users. This meant syncing disparate IDs (like device/session IDs vs. user IDs, marketing attribution/UTM parameters), involving data engineers, and running complex joins across siloed systems—often outside the product stack.
What’s New
ThriveStack now offers auto-correlation between website analytics and product analytics using our BowTie Revenue Architecture data model:
No manual data stitching
No data warehouse exports
Just seamless insight from anonymous visitor to active user
Why It Matters
This breakthrough eliminates silos between marketing and product analytics—unlocking full-funnel visibility with zero engineering effort.


.gif)
.png)


