At ThriveStack, our analytics platform is central to delivering real-time insights to our users. However, as our user base expanded, we encountered significant performance bottlenecks in data-collection and processing pipelines that continuously challenged the reliability of our services.
This post outlines how a small team, operating under continuous production traffic, systematically transformed our analytics architecture to handle over 10,000 requests per second (RPS).
Identifying the Bottlenecks
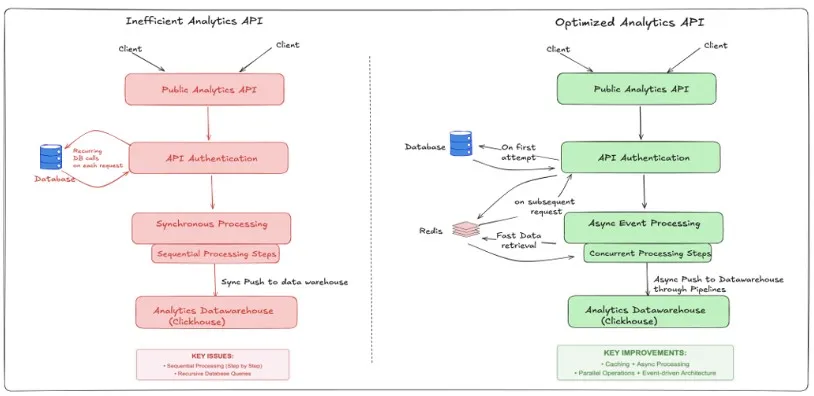
Our initial architecture struggled to scale, primarily due to:
Redundant Database Queries:
Repeatedly fetching identical data for similar requests.
Lack of Caching Mechanisms:
Every request initiated full data processing pipelines.
Synchronous Processing:
Requests were processed sequentially, leading to increased latency.
Blocking Writes to Click House:
Data ingestion operations were synchronous, causing delays during high traffic periods.
Strategic Architectural Overhaul
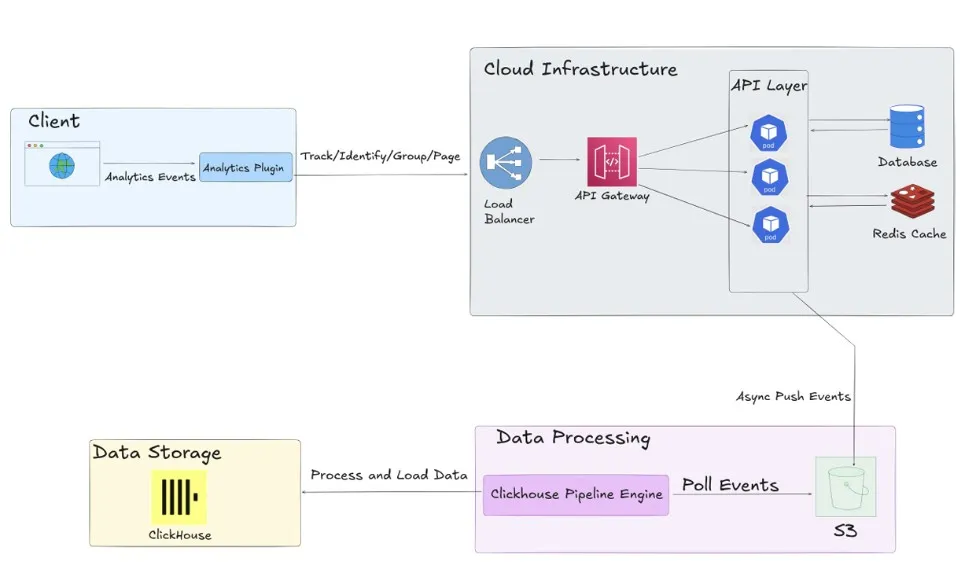
1. Implementing Multi-Layered Caching
To reduce unnecessary database load and improve response times, we introduced the following:
Redis-Based In-Memory Caching: For frequently accessed analytics results.
HTTP-Layer Response Caching: With intelligent cache invalidation strategies.
Pre-Computed Query Result Caching: For common analytics queries.
2. Adopting Asynchronous Processing
We restructured our backend to support asynchronous operations:
Event-Driven Architecture: Decoupling data ingestion from query processing.
Parallel Request Handling: Utilizing async/await patterns for non blocking operations.
Asynchronous ClickHouse Writes: Implementing write buffers and background processing.
3. Leveraging Kubernetes for Autoscaling
To ensure our system could adapt to varying loads, we utilized Kubernetes features:
Horizontal Pod Autoscaling (HPA): Adjusting pod count based on CPU and memory metrics.
Custom Metrics Scaling: Using Prometheus metrics to scale based on queue depth and request latency.
KEDA ScaledObjects: Implementing event-driven scaling for processing components.
Performance Outcomes
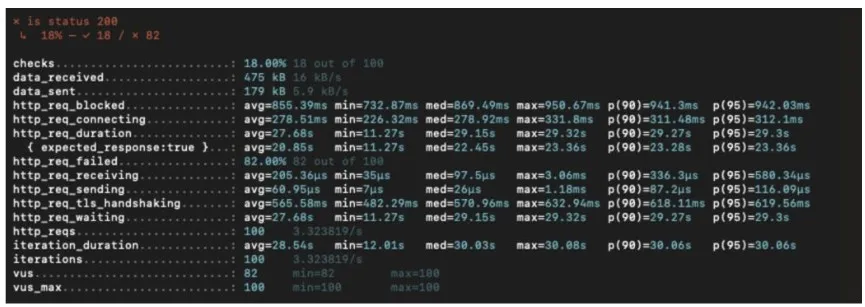
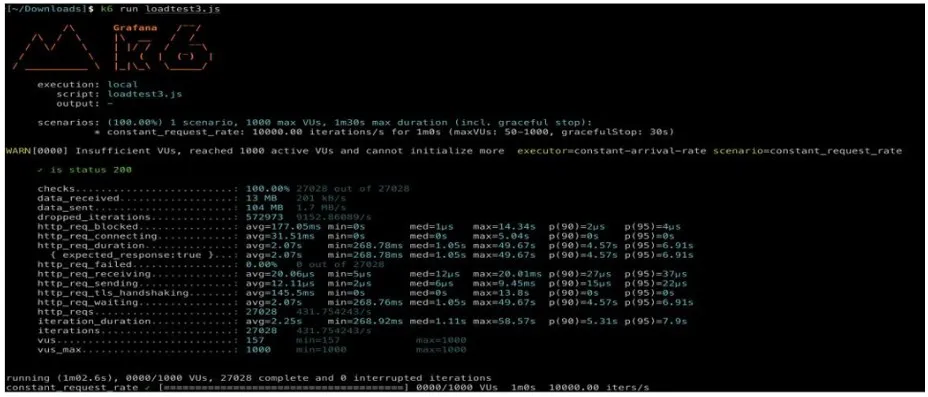
The architectural changes led to significant improvements:
Scaling Results:
1. Before:
2. After
Key Learnings
- Design for Concurrency: Asynchronous processing should be integral from the outset.
- Strategic Caching: Implement caching based on actual usage patterns.
- Data-Driven Optimization: Use instrumentation to identify true bottlenecks.
- Intelligent Autoscaling: Carefully tune scaling thresholds for optimal performance.
- Efficient Database Writes: Optimize write patterns to enhance overall system performance.
Conclusion
Scaling an analytics platform under continuous production load is a complex challenge. Through targeted architectural changes and a focus on asynchronous processing, caching, and autoscaling, we significantly improved our system's performance and reliability. This transformation underscores the importance of proactive scalability planning and iterative optimization in high-demand environments.
Discover how ThriveStack can optimize your analytics infrastructure for high-demand environments with auto-scaling, caching, and asynchronous processing.
Learn More and Start Scaling with ThriveStack
Frequently Asked Questions (FAQs)
1: Why didn’t you just scale vertically or increase server capacity?
Vertical scaling would have delayed the problem, not solved it. Our system had architectural inefficiencies that no amount of hardware could fix. By addressing the root causes—synchronous operations, lack of caching, and monolithic processing— we achieved sustainable scalability without excessive cost.
2: How did you test your changes under real-world conditions while maintaining production stability?
We implemented changes incrementally using feature flags and blue-green deployments. Each iteration was load-tested in a controlled staging environment and gradually rolled out to production with observability instrumentation in place to monitor impact in real time.
3: What caching strategy worked best for your use case?
Layered caching proved most effective. We cached at multiple levels—query results in Redis, HTTP responses at the edge, and hot path results in-memory. This ensured freshness where needed and maximum reuse of processed data elsewhere.
4: What metrics were most useful for driving autoscaling decisions?
While CPU and memory metrics were useful initially, queue length, request latency, and ingestion backlog proved to be more reliable indicators of true system load. We exported these metrics to Prometheus and used them to trigger autoscaling events via KEDA and HPA.
5: Would you approach this scaling challenge differently if starting from scratch?
Yes—concurrency would be a first-class citizen from day one. We would also design with observability, caching strategy, and autoscaling hooks built-in from the start, rather than retrofitting these features later under production load.


