The overlay shows human visits, bot hits and revenue on one chart.
Read the four headline numbers first, then the daily chart. AI assistant visits, AI bot activity, website visits and revenue share one timeline, so you can see crawlers arrive, citations follow, visits come next and revenue lag behind.
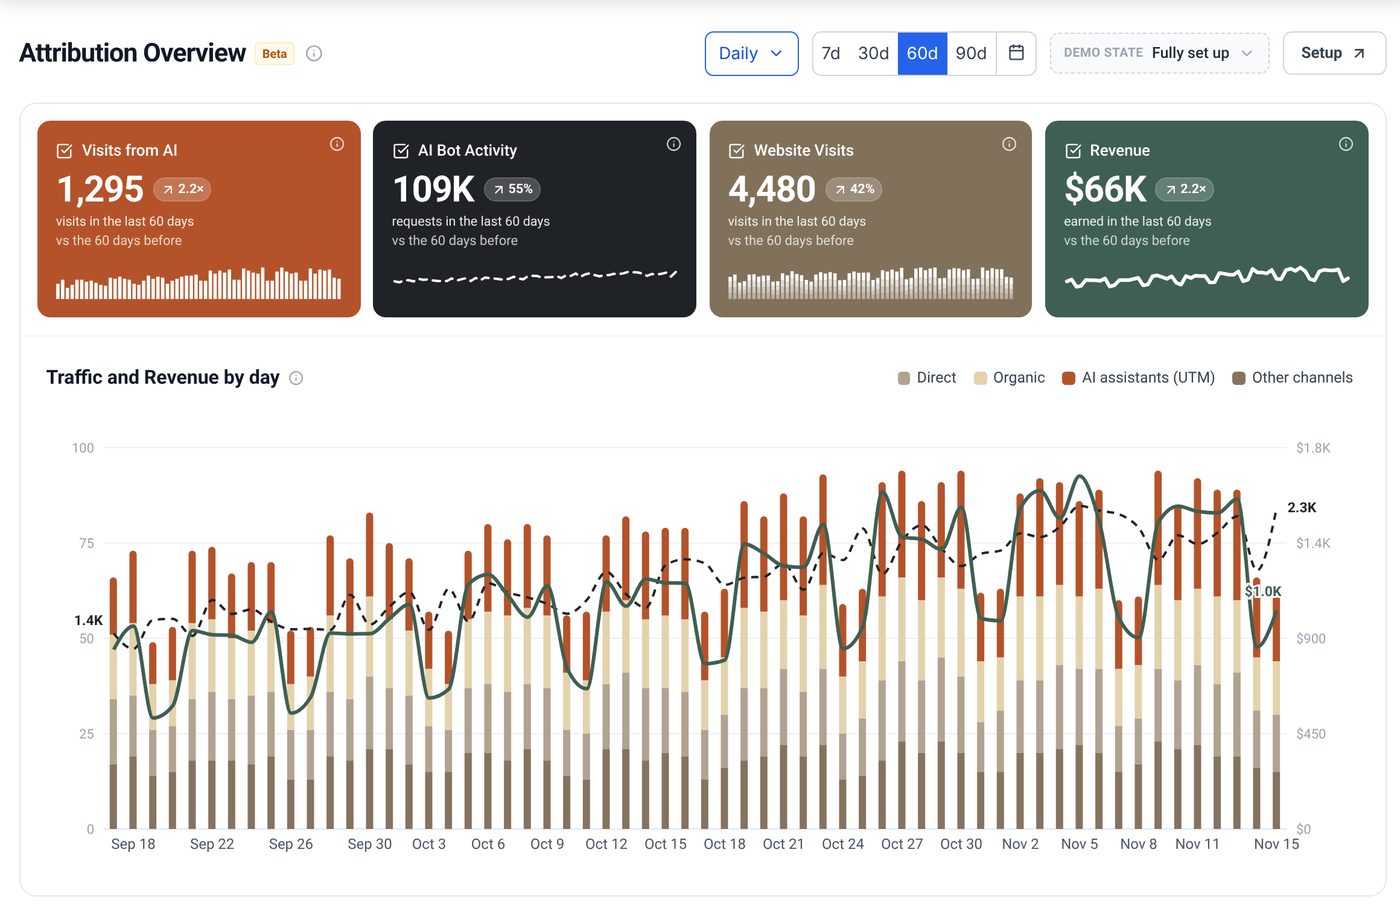
Read the overlay chart in four steps.
- 1
Start with the four headline numbers
AI assistant visits, AI bot activity, website visits and revenue for the period tell you the scale before you read the chart.
- 2
Find when AI crawlers arrive
AI bot activity rises first, when AI engines read your pages. These hits come from server logs, not from your analytics tag.
- 3
Watch for AI visits next
AI assistant visits follow once engines start to cite the pages they read. Direct and organic sit in the same stack, so you can see when AI visits drift into direct.
- 4
Check revenue last
Revenue lags behind visits, often by a month or two, because buyers sign up and pay later. Read the revenue line over a long window.
What a healthy overlay chart looks like.
A good sign: AI bot activity rises on the pages you care about, AI assistant visits follow, and revenue from those visits climbs a month or two later.
A warning sign: bot activity stays high while AI visits stay flat. AI engines are reading your pages but not sending people. Lesson 8.2 shows how to find those pages.
Where each line on the chart comes from.
Each line has its own source. Human visits come from your analytics tag. AI bot hits come from server logs or crawler sources such as Cloudflare, Vercel and WordPress. Revenue comes from billing, joined to visits through one shared field.
Lesson 4.3 explains crawler logs, lesson 6.1 connects your site and analytics, and lesson 6.2 connects billing so revenue joins AI visits.