Five techniques, taught across the lessons, close those gaps.
No single method sees everything. This guide teaches five and shows how to combine them. Each section shows the technique in the ThriveStack citedby demo workspace, with sample data.
1Technique 1 of 5
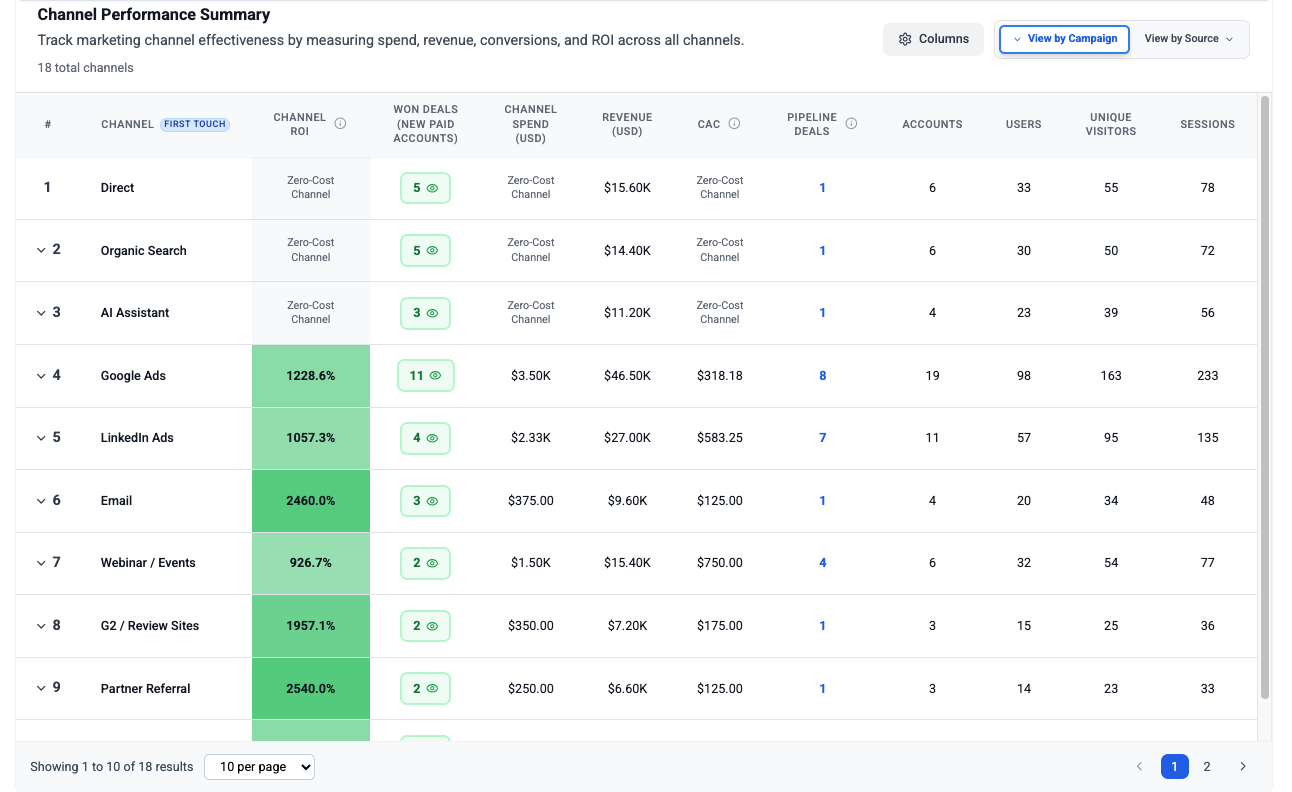
Channel performance
See AI search next to organic and direct, by revenue and by sessions, so you know if an AI visit is worth more or less than any other.
 1234
- 1Channel ROI. Zero-cost channels show as such, paid channels show a percent.
- 2The AI Assistant row sits next to Direct and Organic search.
- 3Won deals from new paid accounts, per channel.
- 4Switch between campaign and source views.
2Technique 2 of 5
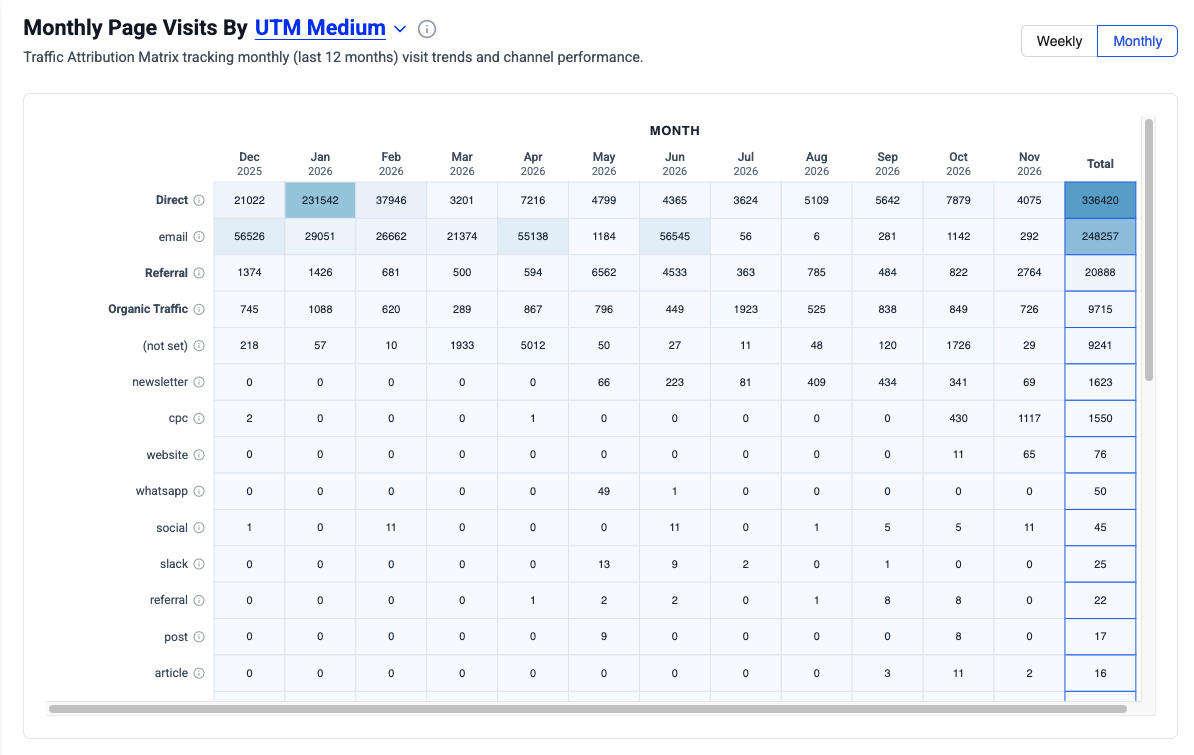
UTM and referrer tracking
Find the visits that arrive with a tag or a referrer, and learn which engines send neither.
 1234
- 1Pick the UTM field to group by, such as medium.
- 2Direct is the biggest bucket: visits with no tag and no referrer.
- 3Referral shows visits that arrived with a referrer.
- 4Totals per source over 12 months.
3Technique 3 of 5
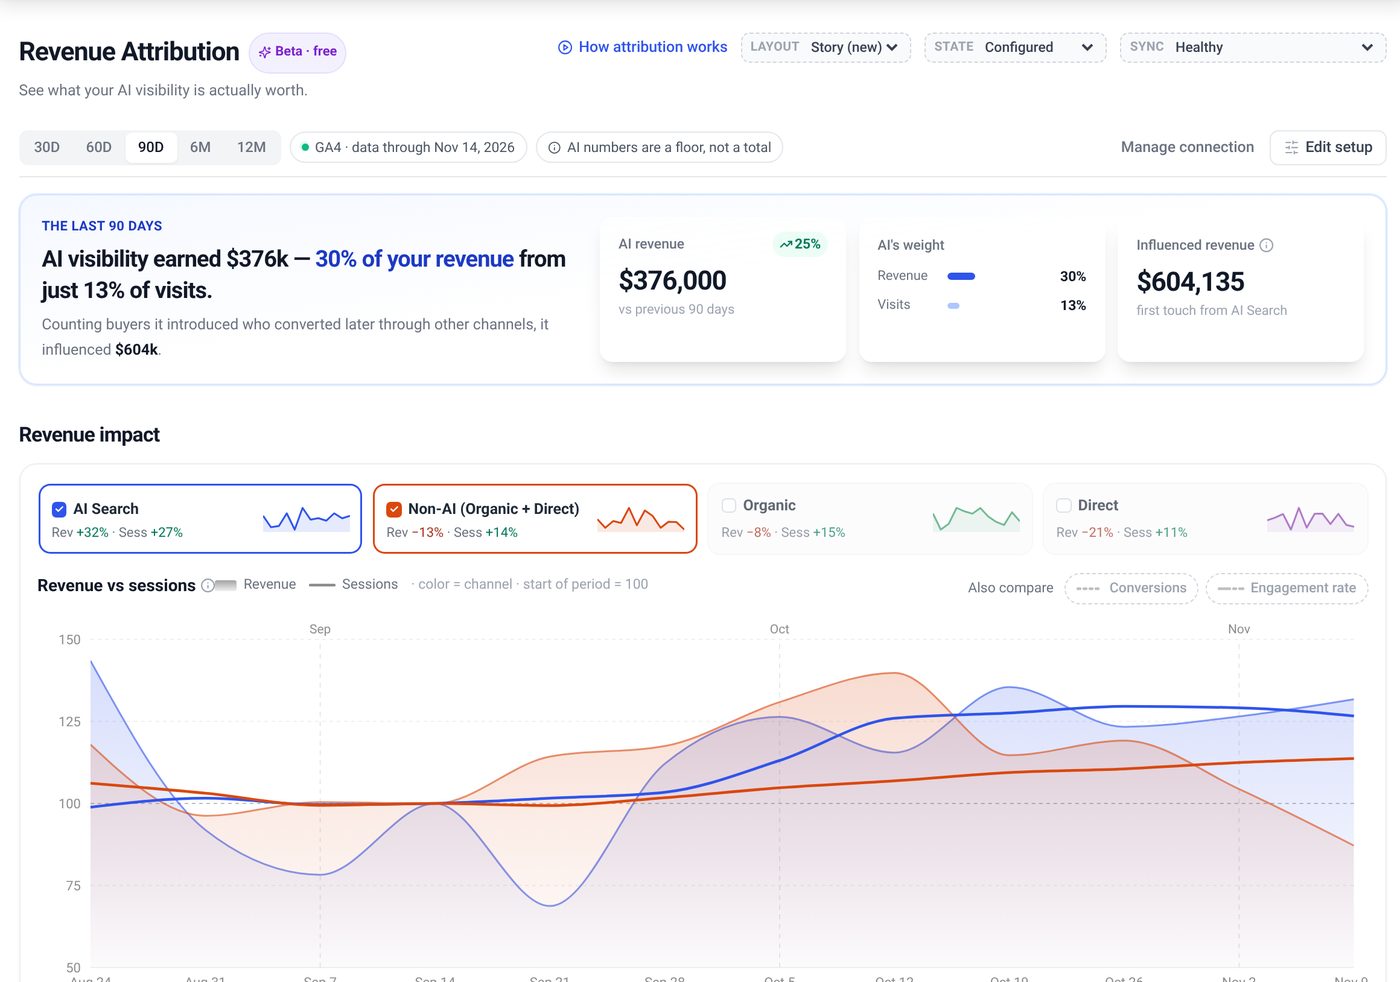
Revenue tracking
Join the visit to the signup and the payment, and report sourced and influenced revenue as two lines.
 1234
- 1One sentence: AI revenue and its share of all revenue.
- 2AI revenue, compared with the 90 days before.
- 3AI weight: share of revenue next to share of visits.
- 4Influenced revenue: AI was the first touch.
4Technique 4 of 5
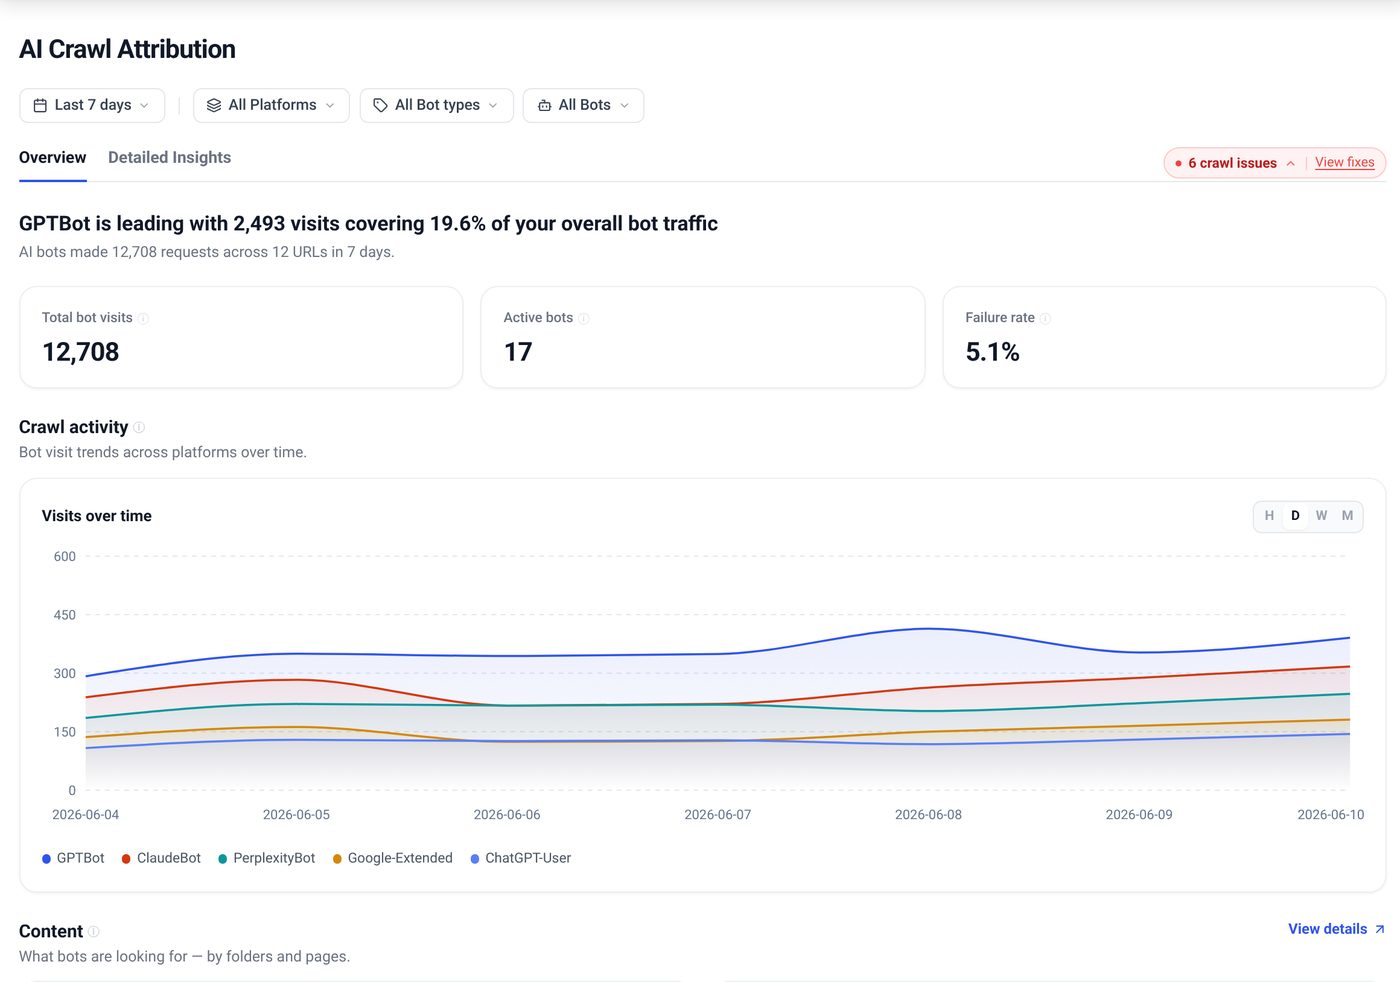
AI crawler server logs
Read what AI bots fetch, by bot type, folder and URL. Analytics never sees them.
 1234
- 1Which bot leads, and its share of bot traffic.
- 2Total bot visits, active bots and failure rate.
- 3Visits over time, one line per bot.
- 4Crawl issues to fix.
5Technique 5 of 5
The overlay: human, bot, cited pages and revenue
Put visits, bot hits, citations and revenue on one chart to see the order of events.
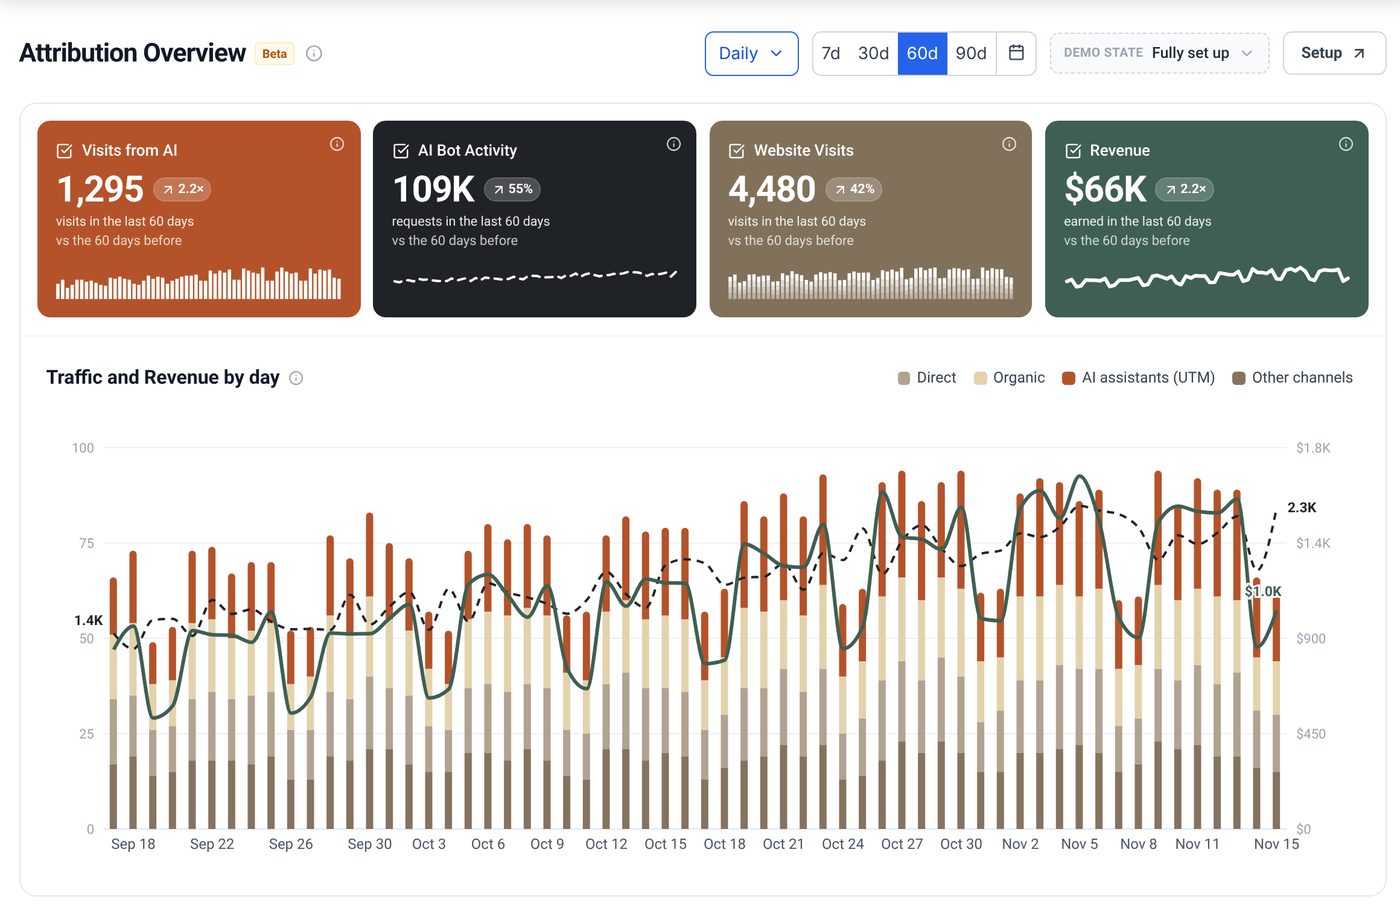 1234
- 1Four numbers: visits from AI, bot activity, website visits, revenue.
- 2Channels in the chart: direct, organic, AI assistants, other.
- 3Bars are visits, the green line is revenue, the dotted line is bot hits.
- 4Pick the range and the daily or weekly view.