
Growth Leaks
Stop Losing Accounts After Onboarding
Uncover your Growth Drivers and Growth Leaks by correlating engagement, feature usage & account-level signals
Identify your Growth Drivers, detect Growth Leaks, and boost product stickiness.
Built for Product & Growth Teams
Obsessed With Usage and Retention!
Product Managers
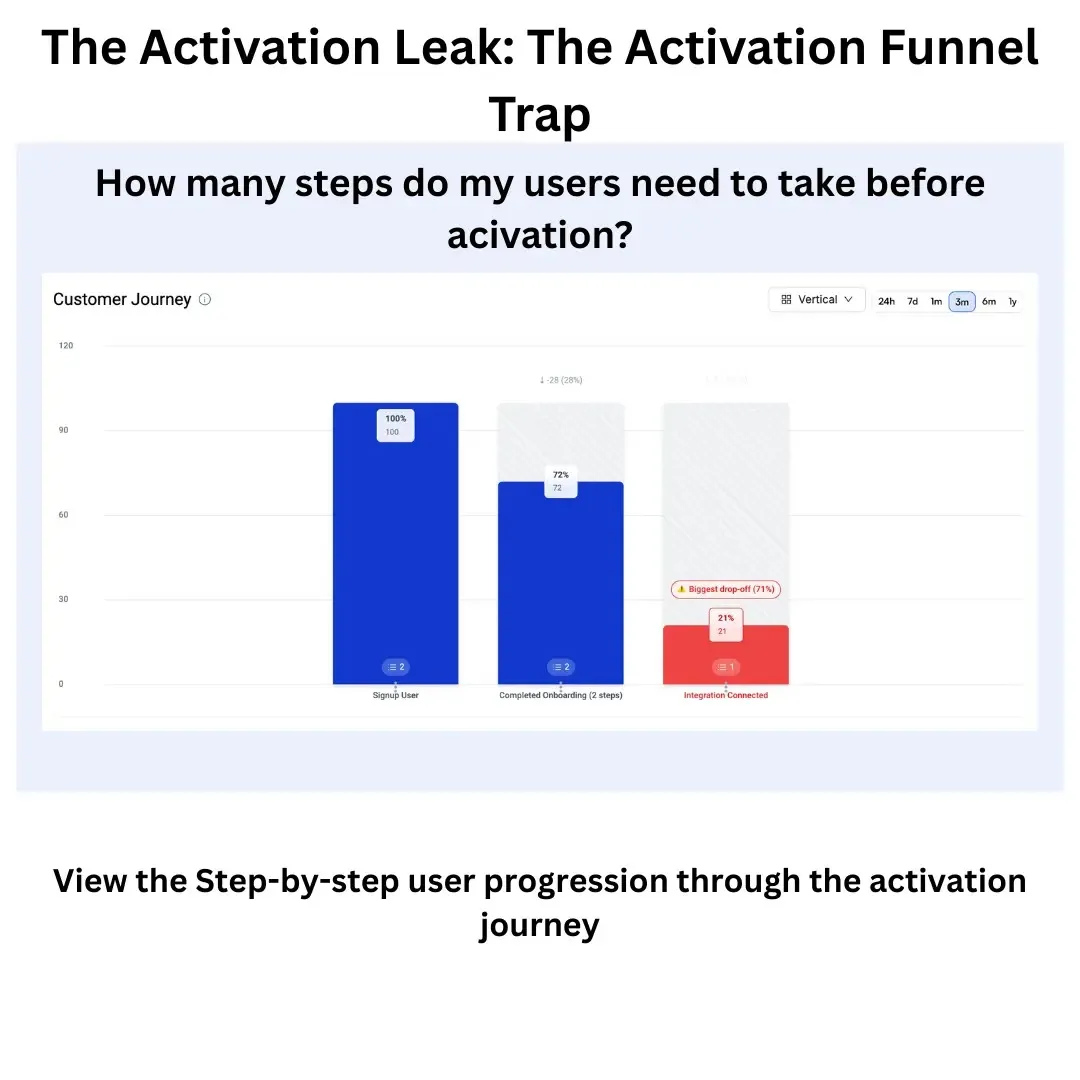
Tracking feature usage but missing context on what drives repeat behavior—or where adoption quietly drops off.
Growth Teams
Analyzing user and account data without a clear view of what keeps different segments active over time.
Founders
Measuring engagement across segments, but struggling to connect insights to retention, upsell, or roadmap bets.
Engineering & Data Teams
Building features based on assumptions—without feedback loops that show what’s working, what’s ignored, and why.
Top Engagement Leaks
Because knowing who visits isn’t the same as knowing who converts.
.webp)
.webp)
.webp)
Turn Feature and Account Usage Into Real Growth Signals
Expert Insights: Fixing Product
Engagement Drop-Offs
"The best predictor of customer retention is product usage. If customers are engaged, they’re more likely to renew and expand."

"Increasing product engagement is the single most important indicator that your customers are finding value—and that they’ll stick around."

"If you want to predict churn, look at engagement. If you want to drive expansion, look at engagement. It’s the common denominator."

"You can’t grow revenue without growing engagement. Expansion and retention are natural outcomes of a product that’s habitually used."

What Top SaaS Teams Track to Plug
Engagement Leaks
Metric
- DAU, WAU, MAU
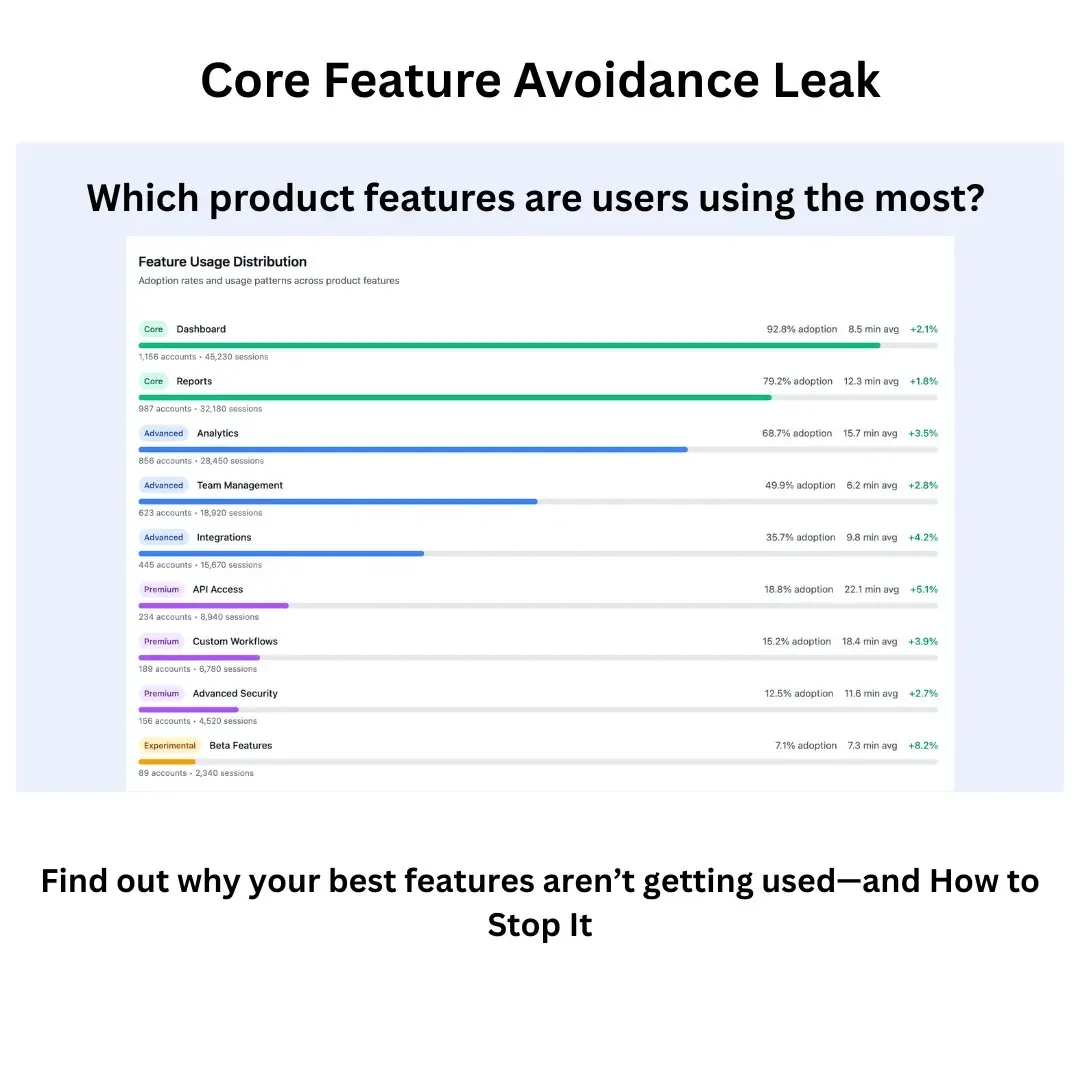
- Feature Adoption
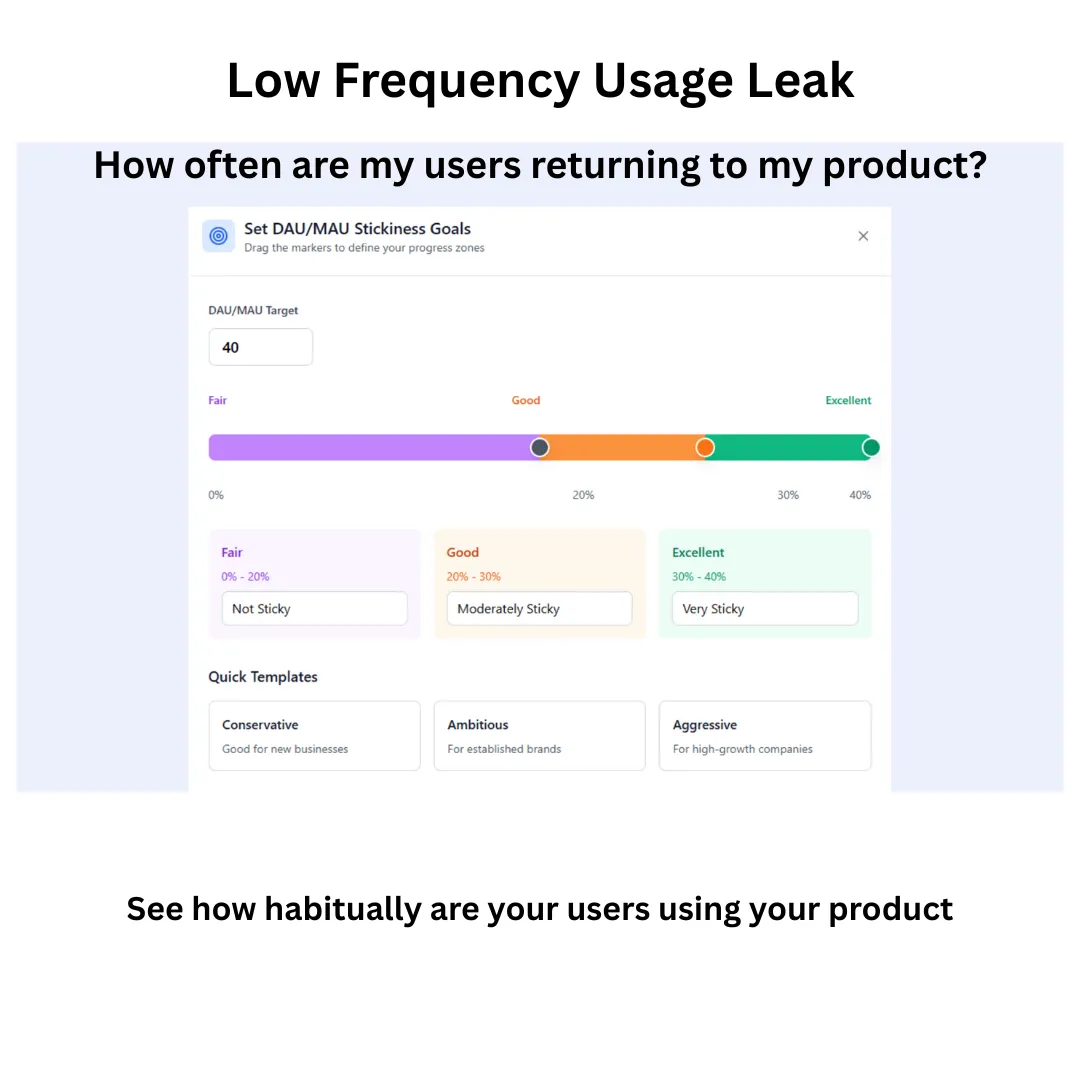
- Product Stickiness
- Account-Level Usage
- Churn and Usage Correlation
Why It Matters
- Core indicator of active user base
- Which features drive repeated engagement
- DAU/MAU ratio shows retention potential
- Shows health across key customers
- Align customer actions with behavior
When You Fix Engagement Leaks, Here’s What Happens to Your Metrics
Growth Leaks Weekly — Join 100K+ SaaS Leaders
Actionable insights on fixing acquisition, activation, and retention blind spots — straight to your inbox.
No fluff. Just growth wins and warnings.
Ready to Fix Silent Drop-Offs and Boost Engagement?
Let’s turn passive users into engaged customers — proactively
- Detect feature drop-offs and low-engagement workflowsAlerts when usage stalls post-activationUncover power users and stickiness signalsAccount-level insights into your Growth Drivers and Growth Leaks