
When Activity Fades, Revenue Follows
Every day a user goes inactive, you’re leaking ARR you’ll never get back.
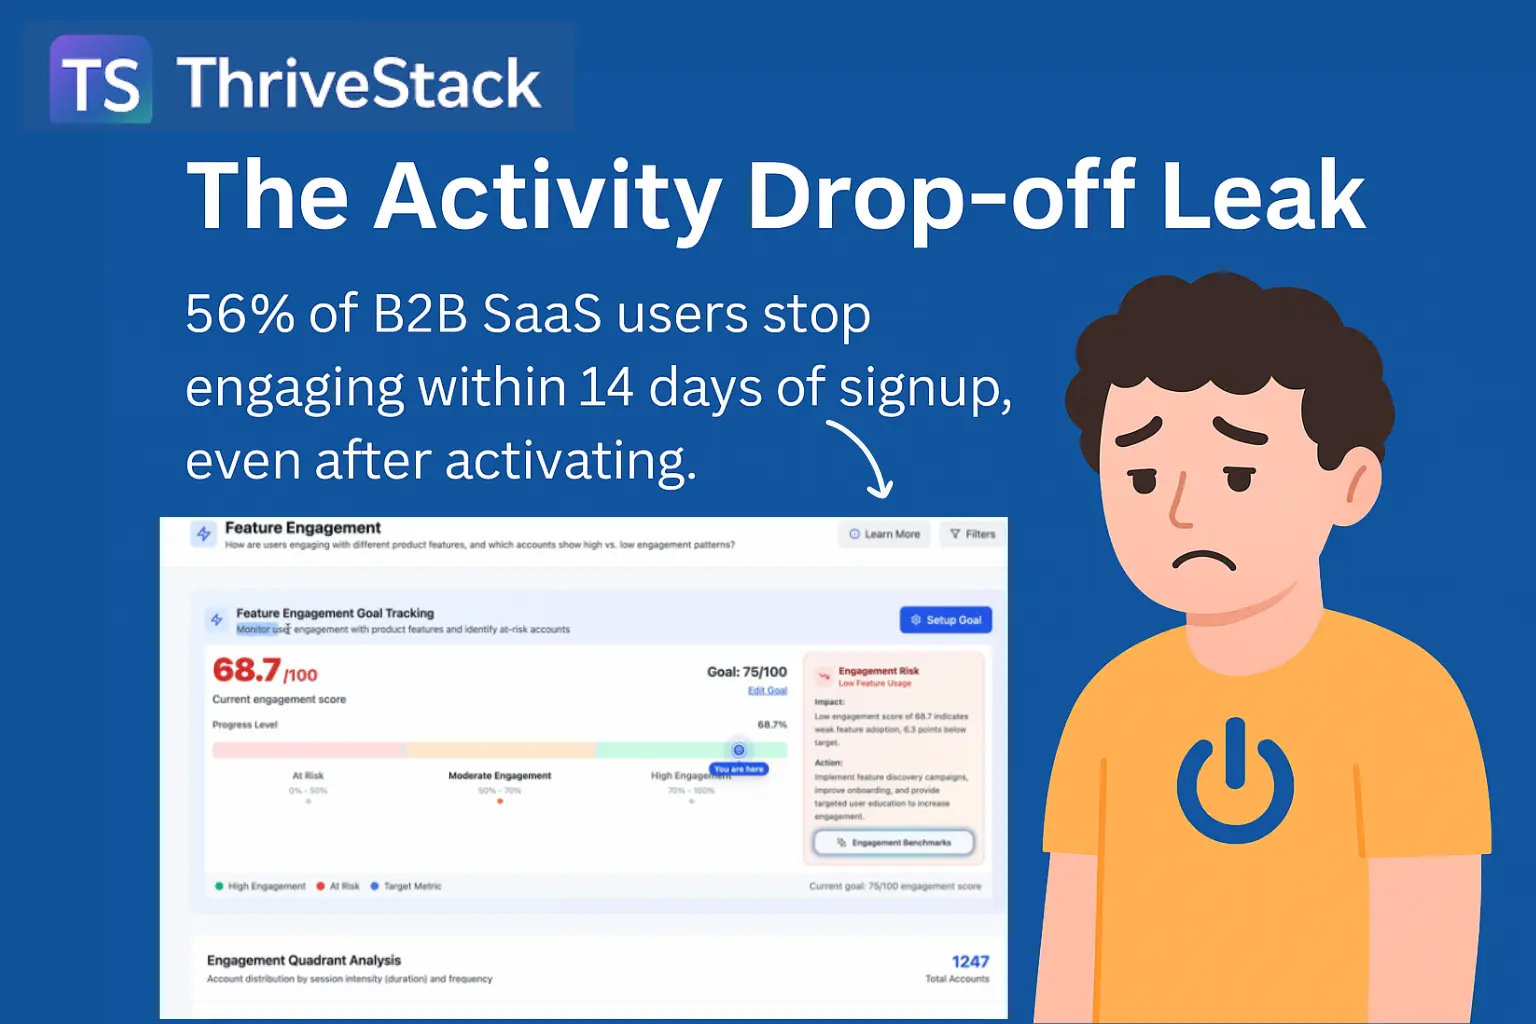
Leak Description: The Activity Drop-off Leak
The Activity Drop-off Leak is what happens when your new users or customers start strong, then quietly fade—stopping logins, reducing core actions, and eventually ghosting your product. Instead of building daily habits, they disengage.
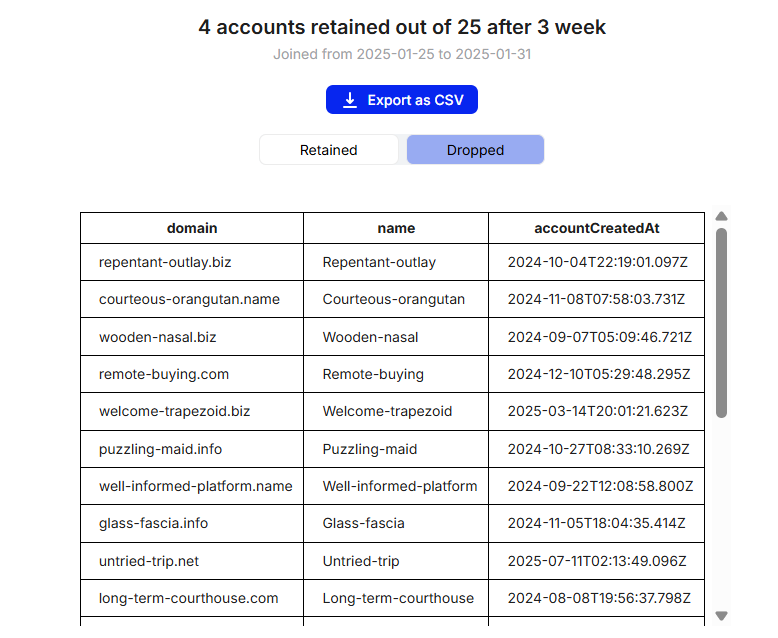
Example: A SaaS analytics platform with a 30% drop in DAU (Daily Active Users) after just two weeks post-onboarding, leaving most accounts dormant until renewal time.
Why You Should Care
SaaS companies lose 70% of new users within 90 days, and
- Activated users are the most expensive to lose. You already won them once.
- Drop-offs distort retention and cohort metrics.
- Silent drop-offs rarely give feedback—but they inflate your active user base until it's too late.
"Engagement is a leading indicator of retention. You lose users long before they cancel."
— Hila Qu, Growth Advisor
Why the Leak Happens
Root causes:
- Shallow onboarding: Users never find product value.
- Feature Overload: Too many options, not enough direction.
- No Activation Hook: Lack of early habit formation or reward.
- Psychology: The “Sunk Cost Fallacy” fades; users forget why they started.
“People abandon tools that don’t deliver value quickly—or don’t become a routine.” — Laurie Santos, Yale Professor
How to Detect the Activity Drop-off Leak
Step-by-step:
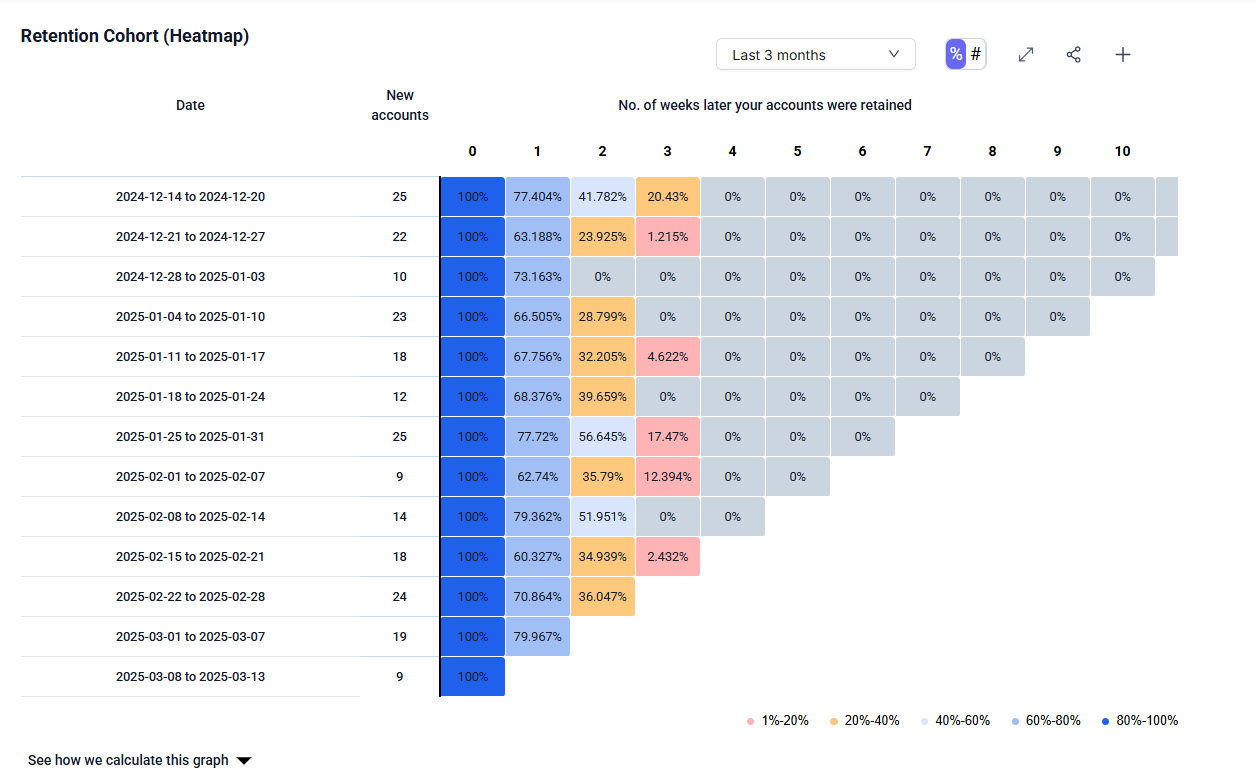
- Track DAU/WAU/MAU retention curves
- Measure % of new users active on days 1, 7, 30
- Analyze drop-off points in core product journeys
How ThriveStack Can Help with the Activity Drop-off Leak
Please review the content. This is auto-generated and may not match the product features.
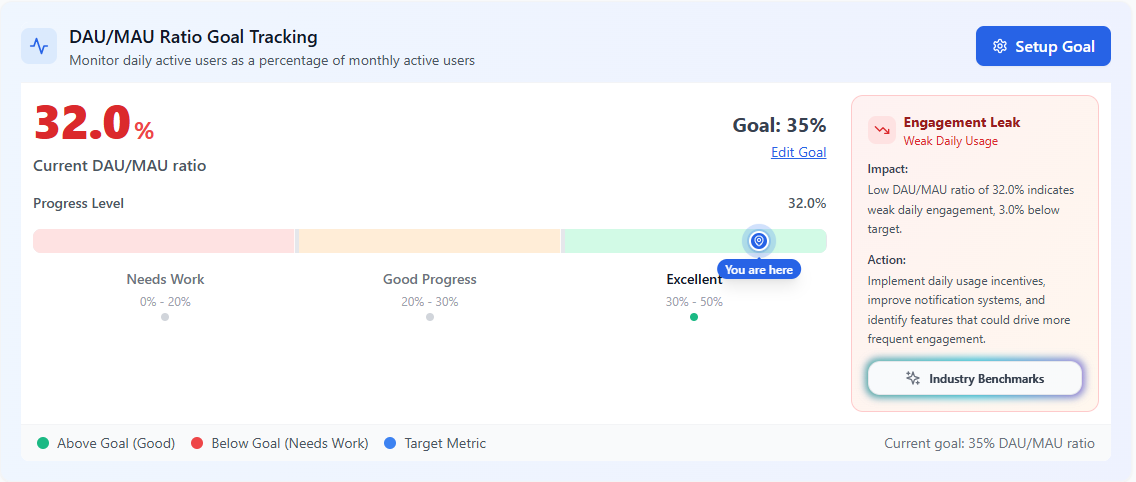
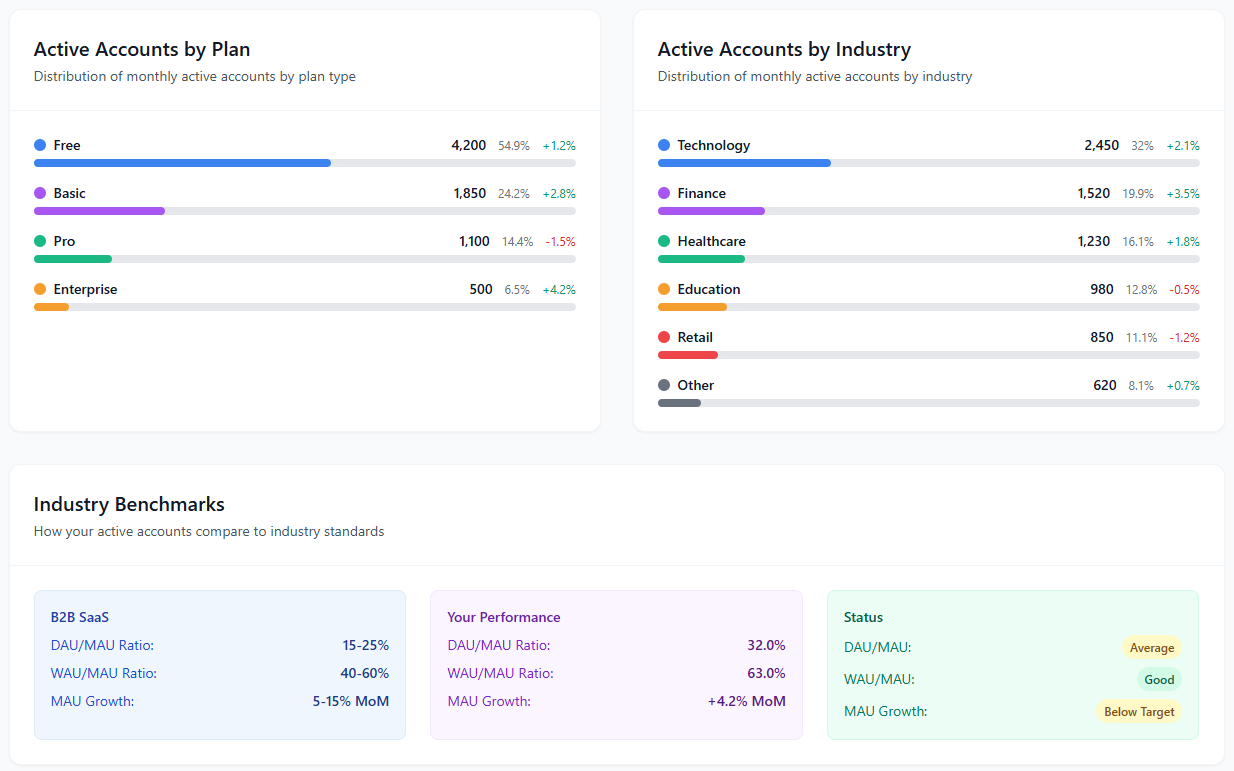
Note: Prateek, please add product walkthroughs for this sectionDAU/MAU ratio tracking dashboard showing a 32% engagement rate, indicating weak daily usage and recommending actions to reduce activity drop-off.
Features
1.Set and Track DAU/MAU Ratio as a Goal: Monitor daily active users as a percentage of monthly active users.
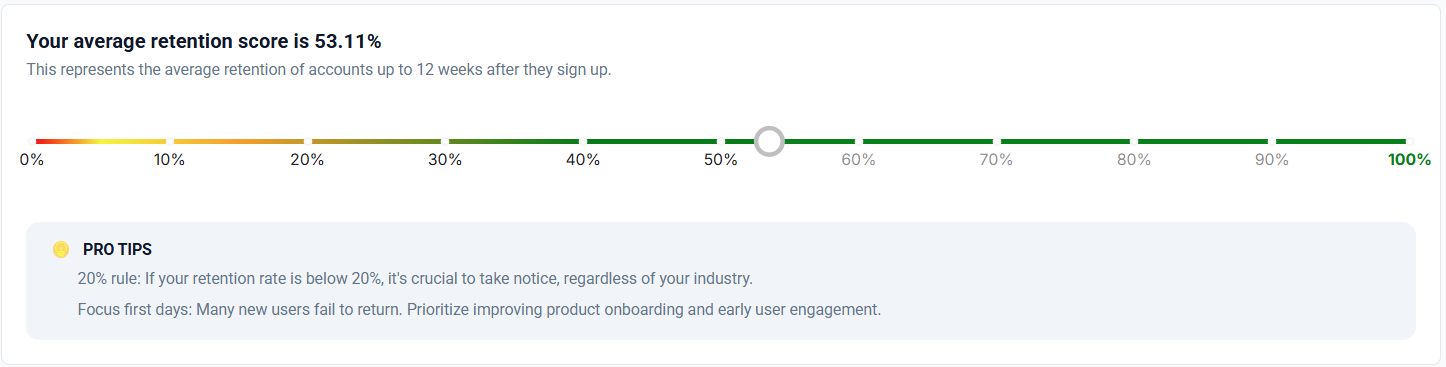
2.7- to 30-day return rate: If users don’t return after activation, that’s a leak.Account Intelligence > Account Retention
3. Session frequency tracking: How many active days per user over time?
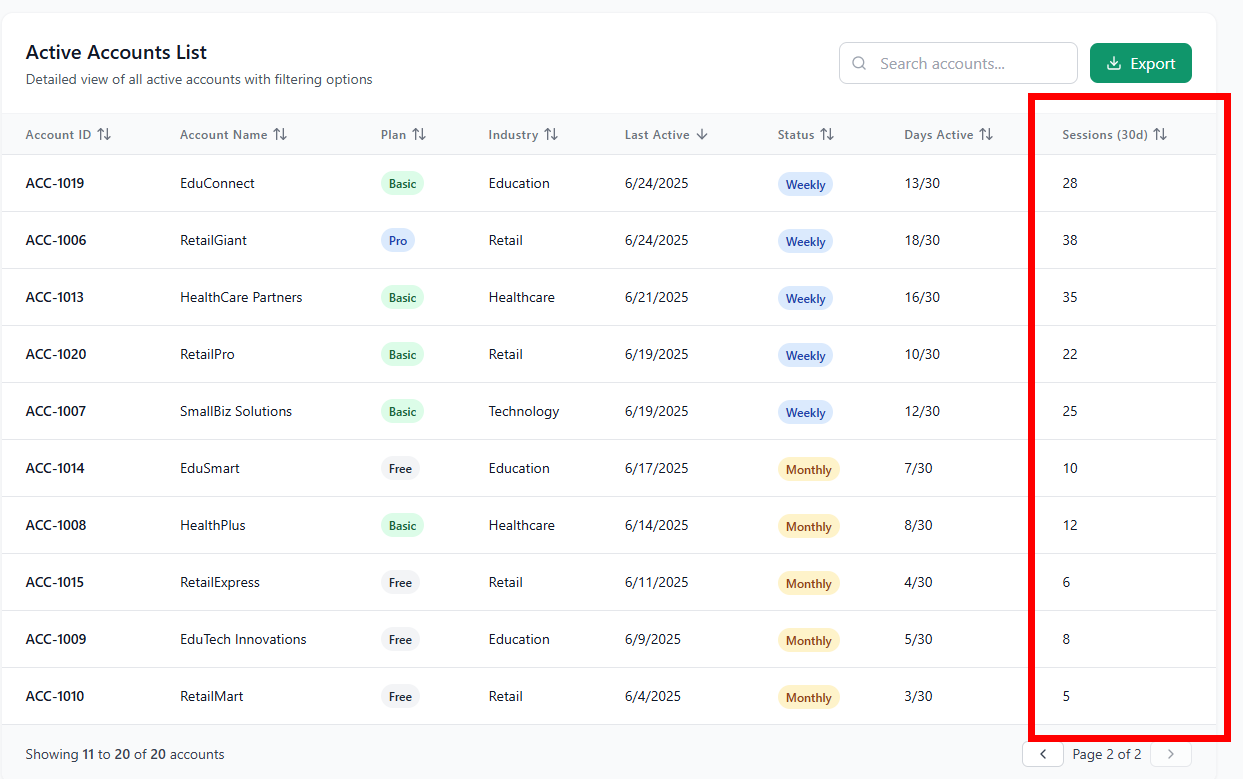
4. Segment activated-but-inactive users in ThriveStack.
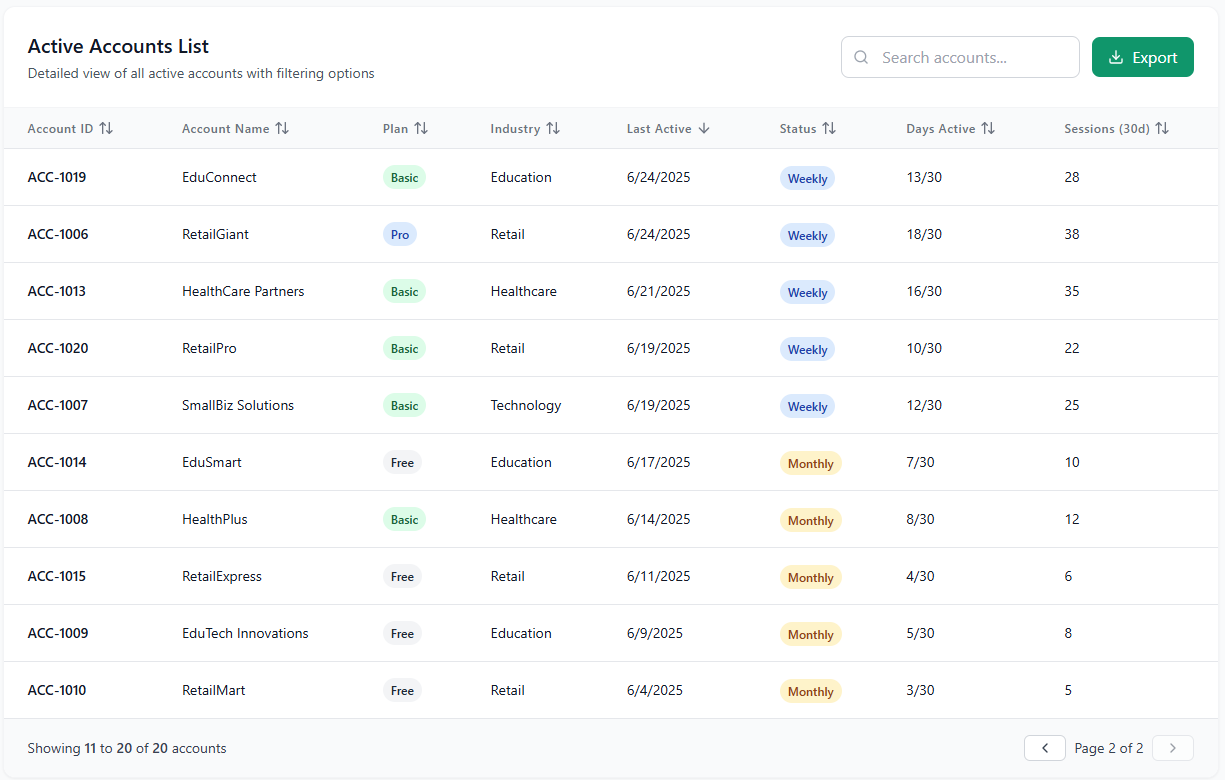
5. Compare to ICP benchmarks: Are certain personas, Industries under-engaging?
Fix Actions
- Add post-activation nudges with next best actions.
- Trigger usage-based emails, tooltips, or support check-ins.
- Offer milestone rewards for returning within key windows.
Prevention Strategies
- Embed usage patterns into onboarding: weekly task suggestions.
- Build FOMO or urgency with social proof and streak visuals.
- Incentivize return visits within the first 30 days.
The Psychology Behind the Fix
Habits stick when products deliver consistent value and small rewards. Behavioral nudges, reminders, and positive feedback transform fleeting usage into sticky routines.
“If you want behavior change, reduce friction and reward every step.” — Katy Milkman, Wharton Professor
7. Business Impact of Fixing the Leak
Expected Gains:
- Up to 2x boost in 30-day retention
- 20-40% higher NRR
- Increased customer LTV (Lifetime Value)
8. Expert Quote
"Churn starts the moment a user stops using your product—track engagement, not cancellations. Companies using ThriveStack definitely improve Product Engagement" — Yaakov Carno, Growth Advisor | Valubyl.com
Conclusion: Ready to Fix the Activity Drop-off Leak?(h2)
Every silent user drop-off is a quiet hit to your bottom line. Ignoring engagement gaps means you’re leaking ARR that won’t come back. ThriveStack helps you detect, analyze, and fix these critical leaks—turning passive accounts into active, loyal users.
Don’t just track logins—build lasting product habits.
Try ThriveStack Free or Book a Call Today!
Start Your Free Trial | Book a Demo
FAQ: The Activity Drop-off Leak
1. What is an activity drop-off leak?
An activity drop-off leak happens when users become inactive after initial product engagement. They don’t cancel immediately but quietly disengage—hurting retention and revenue over time.
2. Why is fixing the activity drop-off leak important?
Engagement is a leading indicator of retention. Fixing drop-offs improves customer lifetime value, boosts net revenue retention (NRR), and prevents churn before it starts.
3. How can ThriveStack help?
ThriveStack lets you track session frequency, DAU/WAU ratios, and return visit patterns. It highlights drop-off points, benchmarks user engagement by persona or industry, and triggers automated fixes like nudges, tooltips, and follow-ups.
4. What benchmarks should I track for activity retention?
- Day 1 Retention: 40%+
- Day 7 Retention: 20%+
- Day 30 Retention: 10%+
- Time to Core Action: Under 1 day
5. What’s the fastest way to reduce drop-offs?
Start by setting up automated post-activation nudges, usage reminders, and milestone rewards. Use ThriveStack’s cohort analysis to monitor what’s working in real time.