“Running global campaigns without region-level insights is like fishing across oceans… without knowing which waters yield the catch.”
What Is the Geo-Growth Leak?
The Geo-Growth Leak arises when SaaS marketers run campaigns globally but don’t analyze performance by region—losing context on where impressions, traffic, and conversions truly thrive. Without regional clarity, resource allocation, messaging, and scaling strategies falter.
What Campaign Metrics Should You Expect (5–6 Months)
To evaluate performance by region, track monthly impressions and new visitors, benchmarking these numbers to detect underperformance or opportunity areas:
Impressions:
Industry benchmarks (PoweredBySearch): B2B SaaS Google Ads campaigns see ~31,000 impressions per month. poweredbysearch.com
New Visitors:
- Goal: 5–15% M/M growth in unique new visits.
- Exceptional regions may see 20%+ growth month-on-month.
CTR & CPC regional variation
- Search Ads: average CTR ≈ 3.17%, average CPC ≈ $2.69. storegrowers.com
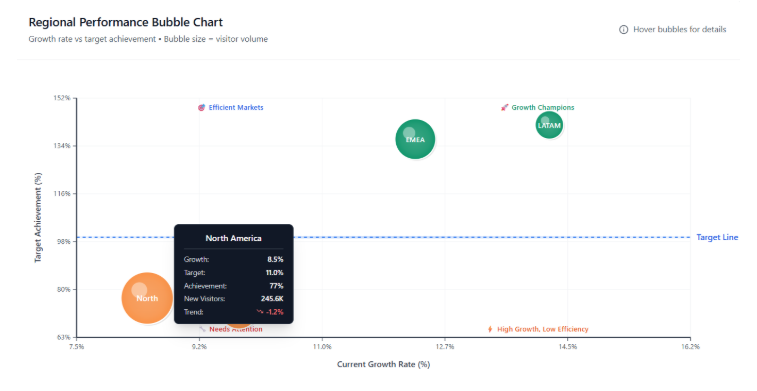
Regional Campaign Performance (5–6 Months)
Benchmarks based on PoweredBySearch & StoreGrowers data poweredbysearch.com
Why Regional Effort Matters
Regional campaign data helps:
- Target more effectively—message in local language, time zone, and pain points.
- Budget allocation—scale in high ROI regions, pause low performers.
- Product positioning & language localization—adjust based on regional engagement.
Marketers on Geo-Targeting
“Google only loves you when everyone else loves you first.”
— Wendy Piersall on building regional momentum activecampaign.com
“Don’t find customers for your product, find products for your customers.”
— Seth Godin—perfect for regionally tailored offerings activecampaign.com
How to Calculate Metrics
- Impressions/Month — total times ads are served within region.
- New Visitor Growth = ((Visitors_this_month − Visitors_last_month) ÷ Visitors_last_month) × 100
- Regional CTR = (Clicks ÷ Impressions) × 100
- CPC = Spend ÷ Clicks
How to Fix the Geo-Growth Leak
- Segment campaign data by country/region in Google Ads, analytics platforms, ThriveStack.
- Create localized ad campaigns—language, offers, imagery tailored per region.
- A/B test messages by geography—compare performance of different creative or incentives.
- Adjust budgets weekly—shift toward regions hitting high CTRs, low CPCs, and strong new-user growth.
- Integrate conversions per region—not just impressions; watch MQLs and trial starts by region.
ThriveStack: Your Geo-Growth Fixer
ThriveStack’s regional tools empower teams to:
- Campaign Performance Reports by Region showing MoM growth per region.


Trend Regional Performance for Campaigns across a period of time, say 5-6 months

Understand which regions are Drivers / laggards
Summary
Target benchmarks:
- Impressions: ~15k–50k/month by region
- New visitor growth: +5–15% M/M
- CTR: ~2.5–3.5%, CPC: ~$2.0–2.7
Geo-targeted campaigns yield better ROI and audience relevance.
Localization + budget alignment → better conversion paths.
ThriveStack turns regional campaign data into actionable growth moves.
Conclusion: Take Control of Regional Campaign Growth
Without regional performance insights, even the best campaigns can quietly bleed efficiency. Whether it’s higher CPC in EMEA or low CTR in APAC, ignoring regional nuances leads to stalled growth and wasted ad spend.
ThriveStack empowers your team to uncover regional trends, optimize targeting, and allocate budgets where growth is real—not just assumed.
Get your regional campaign audit with ThriveStack today and start scaling smarter.
Frequently Asked Questions (FAQs)
1. What is a geo-growth leak in marketing?
A geo-growth leak happens when you run campaigns across regions but don’t evaluate each region’s performance—leading to missed growth opportunities and wasted budget.
2. Why does regional campaign analysis matter for SaaS?
SaaS companies scale faster when they adapt campaigns to regional differences in behavior, CPC, CTR, and engagement—ensuring more efficient ad spend and higher ROI.
3. How can I detect underperforming regions in my campaigns?
Use analytics tools like Google Ads or ThriveStack to track impressions, CTR, CPC, and new visitor growth by region. Watch for flat or negative MoM growth.
4. What’s a good CTR and CPC for B2B SaaS campaigns by region?
Typical CTR ranges from 2.5–3.5%, while average CPC is $2.00–$2.70. North America may trend slightly higher in both, while APAC often sees lower CPCs.
5. How does ThriveStack help fix geo-growth leaks?
ThriveStack automatically segments your campaign data by region, tracks trends over time, and highlights growth drivers vs. lagging regions—enabling smarter budget shifts and localized strategies.