Empowering Founders and GTM Leaders to Turn PMF from an Art into a Science
ThriveStack is proud to introduce the Real-Time PMF Scorecard, a data-driven framework that automates the process of tracking and validating Product-Market Fit (PMF) for B2B SaaS companies. Built on the new industry-standard First Round Capital pioneered called PMF Levels Framework, this capability helps Founders and GTM leaders measure what’s working across Marketing, Product, Revenue, and Customer Success in real time.
ThriveStack is inviting the first 25 early-stage SaaS founders to join and receive 6 months of free PMF report (currently in beta) when they sign up by December 15, 2025.
Making Product-Market Fit Measurable
“Most people describe finding product-market fit as an art, not a science. But when it comes to sales-led B2B startups, we’ve reverse-engineered a method to increase the odds of unlocking it.” — Todd Jackson, Partner at First Round Capital
The Challenge: Product-Market Fit Is No Longer a One-Time Event
In the AI-driven era, PMF is not static (Reforge: Product-Market Fit Collapse). Founders must validate it continuously as markets shift, competitors evolve, and buyer expectations change.
The Real-Time PMF Scorecard transforms the once opaque PMF journey into a measurable, repeatable process.

Understanding PMF Levels Framework
What are PMF Levels?
The PMF Levels Framework, pioneered by First Round Capital and automated within ThriveStack’s Scorecard, First Round Capital, defines the key milestones that indicate progress toward Product-Market Fit. ThriveStack’s Real-Time PMF Scorecard brings these benchmarks to life with automated measurement and cross-functional data correlation.
- Level 01: Nascent – You have a handful of somewhat engaged and happy initial customers but things still feel early and messy. Focus on increasing satisfaction.
- Level 02: Developing – You have more engaged, paying customers and less churn — focus on driving demand.
- Level 03: Strong – Momentum is picking up, and you’re finally feeling the “pull” of demand. Time to focus on efficiency.
- Level 04: Extreme – You’re repeatedly and efficiently solving an urgent problem for a large number of customers who need your product.
Understanding Dimensions
- Satisfaction: Measures the depth of value delivered, how much customers need the product, resulting in low regrettable churn and high Net Revenue Retention (NRR).
- Demand: Measures the breadth of market pull, the ease, speed, and volume at which new customers can be acquired due to the market urgently wanting the solution.
- Efficiency: Measures the scalability and profitability of the business model, proving that revenue growth is repeatable and achievable with strong unit economics, such as high Gross Margin and quick CAC Payback.
- Revenue (Outcome): Measures the scale and quality of financial outcomes tracked by overall ARR growth, but validated by quality metrics li(ke NRR and Gross Margin, which confirm the revenue is repeatable and profitable.
Understanding 4Ps
While the Real-Time PMF Scorecard automates the measurement and diagnosis of your PMF level, it is the founder's job to execute the strategy required to move to the next level. The Four Ps are the strategic levers that B2B SaaS teams must pull to get "unstuck."
ThriveStack measures the outcome, but cannot automate the strategy of the 4 Ps:
- Persona: Who are you selling to? (e.g., Target CFOs instead of Controllers).
- Problem: What pain are you solving? (e.g., Switching from a low-urgency "nice-to-have" problem to a high-urgency, "must-solve" problem).
- Promise: How do you articulate the value? (e.g., Sharpening the core value proposition and marketing message).
- Product: What features and capabilities must you build or refine to achieve a core job-to-be-done? (e.g., adding a critical integration or improving a core workflow).
This strategic work is the core responsibility of the Founders and GTM Leaders, using the Scorecard's data to inform their decisions
Metrics to measure at each level
ThriveStack PMF Report - Feature Highlights

- Unified PMF Analytics: Correlate signals across Product, Marketing, Revenue, and Customer Success.
- Automated PMF Level Scoring: Instantly measure where your company stands—Nascent, Developing, Strong, or Extreme PMF.
- Four-Dimensional Framework: Evaluate PMF across Demand, Satisfaction, Revenue, and GTM Efficiency.
- Segment-Level Comparison: Track PMF progression across SMB, Mid-Market, and Enterprise cohorts.
- Data-Driven Recommendations: Receive actionable insights to accelerate the next PMF level.
Key Benefits
- Accelerate PMF Discovery: Find and validate PMF in half the time using automated scoring and feedback loops.
- Avoid Costly Failures: Early-stage teams gain structure and visibility—reducing the odds of failure that affects 90% of startups.
- Benchmark with Confidence: Compare performance with First Round’s proven PMF benchmarks.
- Drive Repeatability: Align product, marketing, and GTM teams on a shared PMF language and data foundation.
Join the Beta
The Real-Time PMF Scorecard is currently in beta. ThriveStack is inviting the first 25 early-stage SaaS founders to join and receive 6 months of free access when you sign up by December 15.
Interested in seeing it in action? Book your personalized demo now
Frequently Asked Questions
1. What is the Real-Time PMF Scorecard?
A data-driven analytics module within ThriveStack that measures Product-Market Fit across key business dimensions using real-time data.
2. Who is it for?
B2B SaaS founders and GTM leaders from pre-seed to Series A, especially those building repeatable revenue and scaling toward $2–4M ARR.
3. How is this different from surveys or NPS tools?
Traditional surveys capture sentiment; ThriveStack’s PMF Scorecard captures behavioral, revenue, and satisfaction data in real time.
4. Does it integrate with existing tools?
Yes. It connects with your CRM, product analytics, and marketing tools to provide a unified PMF scoring dashboard.
5. When will it be generally available?
Following the beta phase, general availability is expected in early 2026.
6. What’s the fastest way to show PMF to investors?
Show flattening cohort retention for your ICP, and a ≥40% “very disappointed” survey read. Pair it with CAC < LTV and an improving Burn Multiple to demonstrate efficiency. Lenny's Newsletter
7. How many design partners should we aim for?
Enough to cover your primary ICP segments and to produce 3–5 crisp problem/ROI stories. Category leaders keep using design partners even at scale because the feedback loop strengthens fit. First Round
8. Do we need to hit “Extreme PMF” before Seed?
No. But articulate your PMF level (Nascent/Developing/Strong/Extreme), show progress across Satisfaction, Demand, Efficiency, and lay out a credible 90-day plan to climb a level. First Round
9. Is the 40% PMF survey threshold universal?
It’s a widely used benchmark, not a law of nature. Combine it with cohort retention and unit economics for a durable picture. Lenny's Newsletter
10. What’s a good first CAC channel?
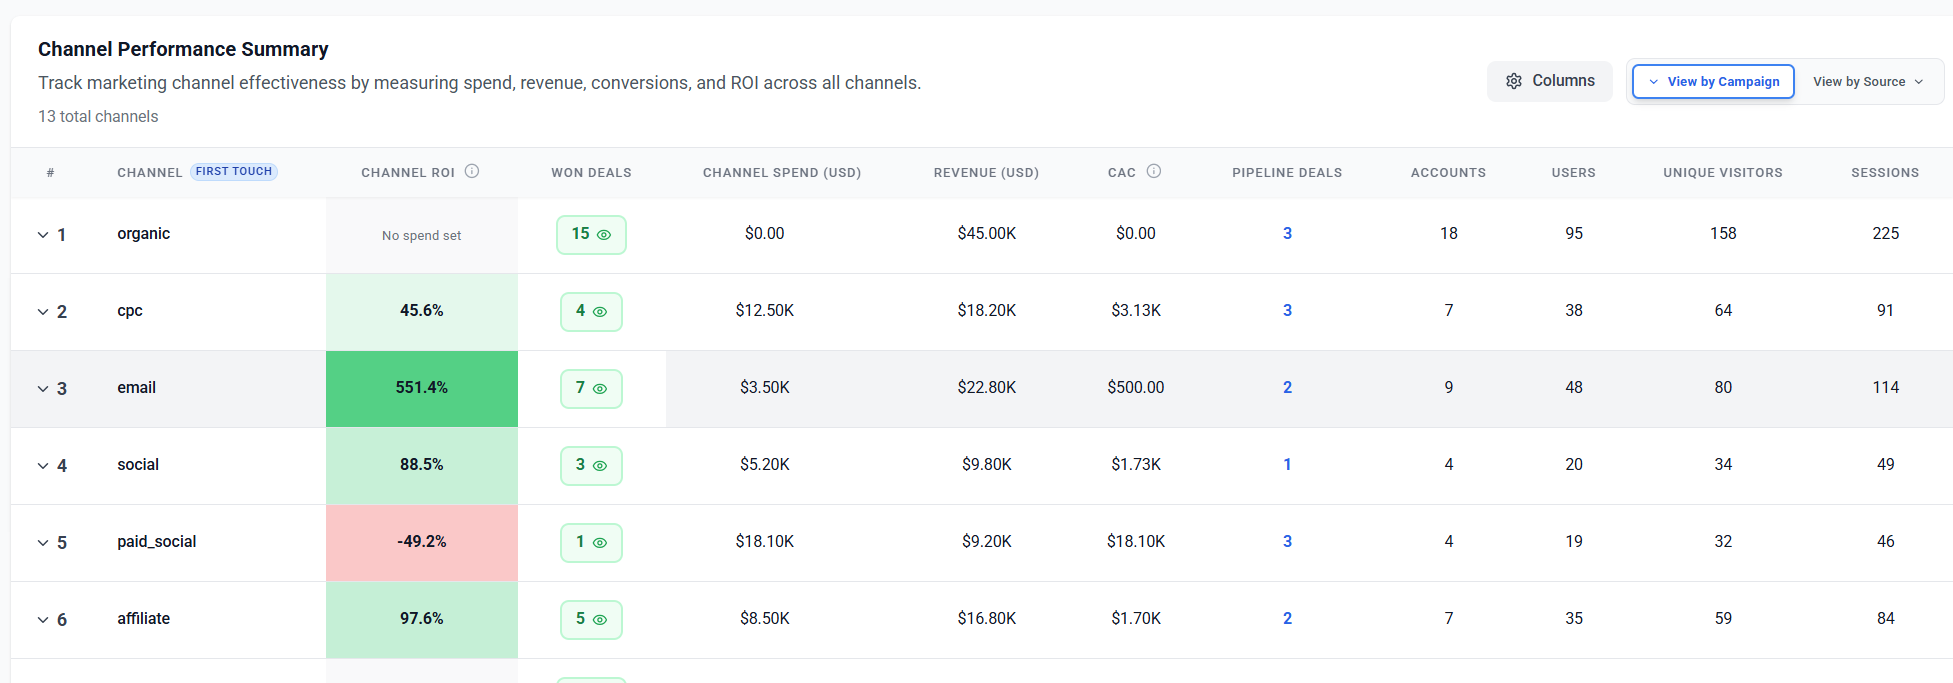
Start with channels (Try Channel Performance report by ThriveStack) that map tightly to your ICP and job-to-be-done—often founder-led outbound to design partners, targeted communities, and product-led activation. Then layer modest paid tests once your message converts. First Round
11. How does Burn Multiple influence fundraising?
Lower Burn Multiple signals that the market is pulling the product (not the other way around). Many investors treat it as a PMF proxy during capital-tight cycles. Lenny's Newsletter


